This article discusses methods to measure basic power (Voltage) quality parameters using a multimeter. Using any advanced digital multimeter (similar to Fluke 87V) many voltage quality data can be obtained without having to spend significant amount of money on installing sophisticated instruments. By using multimeter, we are relying on basic voltage data and comparing that to an ideal sine wave at that frequency to check power quality data.
Phase-Neutral Voltage: RMS phase-neutral [P-N] is the basic reading that anyone should start with. Phase-neutral voltage that is close to ideal is a good starting point for further tests. Small variations ±5% of supply voltage is possible due to loading and is usually acceptable. Voltage tolerance standard such as ANSI C84.1 or other local or national standards can be used to identify if voltage is acceptable or not.
Neutral-Ground Voltage: Magnitude of neutral-ground [N-G] voltage at a receptacle can indicate many useful information about health of the system. A value of few mV to <2V may occur on long circuits and is usually harmless. Fact that you measure small voltage is also an indication that there is no illegal N-G bond at that receptacle.
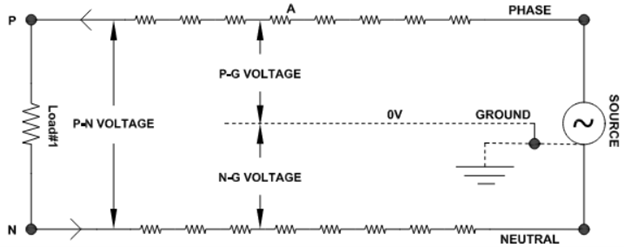
Neutral to ground voltage is an indication of the amount of voltage drop in neutral circuit path. Ground circuit is not expected to carry any current under normal circumstances and is assumed to be at potential of 0V throughout its length, see figure 2. A high N-G voltage (Let’s say >2V) indicates that the neutral circuit is undersized, has loose connections or the neutral current is higher than the design estimates. Remember when non-linear loads (LED lights, computers etc.) are used in different legs of a three-phase system, neutral current add up and can be up to double the phase current. Large neutral current cause neutral conductor voltage drop which can be measured.
Though most devices don’t care about neutral-ground [N-G] voltage, there could be some sensitive electronic devices that may exhibit erratic behaviors when N-G voltage is elevated.
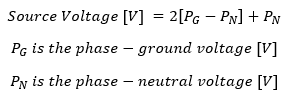
Source Voltage: Source voltage can be calculated for a radial circuit by measuring phase-neutral and phase-ground voltage.
This is an easy and quick way for identifying the source voltage if source transformer is not accessible.
Peak Voltage: Peak value of voltage is an important parameter that will help identify if the voltage waveform is ‘flat topped’ or otherwise has higher peak. Both flat topping and higher peak indicates a waveform that is distorted. Flat topping of voltage waveform occurs when significant number of non-linear loads (LED light, Computer etc.) are connected to the same power supply. Figure 3 (a) shows an example of a flat-topped sine wave. Flat topping is caused when non-linear loads such as switched mode power supplies draw current at the ‘peak’ of AC sine wave. Flat topped waveform causes reduction of peak of voltage which causes other connected devices to ‘starve’ for energy. This can cause reduced performance or even damage of electronic devices.
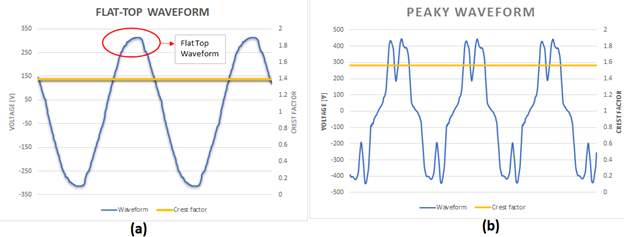
Similarly, a system with significant distortion may also exhibit high ‘peak’ voltage. Example of a voltage waveform with high fifth harmonic distortion is shown in figure 3 (b). Notice the high peak value.
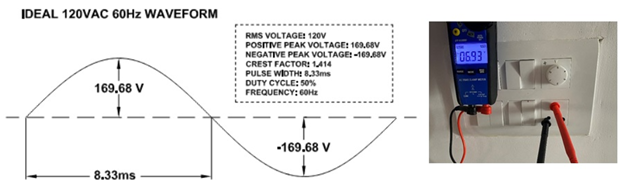
Using the multimeter switch to ‘Peak MIN MAX’ mode. Meter now records the positive and negative peak of AC sine wave. For a 120VAC voltage, ideal positive or negative peak voltage is given by:
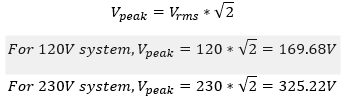

By measuring the peak voltage and comparing it to ideal peak voltage helps give key insight into the shape of voltage wave.
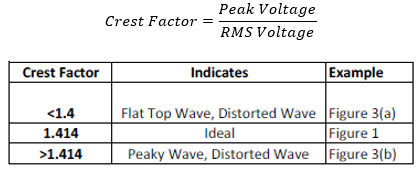
Crest Factor: Crest factor is defined as the ratio of peak voltage to RMS voltage. An ideal sine wave (irrespective of voltage) should have a crest factor of square root of two which is 1.414. Crest factor for harmonic rich waveforms will be higher indicating a short duration (possibly) but high amplitude waveform. A low crest factor (below 1.414) is an indication of flat-topped waveform which is caused by excessive amount of switched mode power supply type single phase loads.
For regular multimeters, crest factor needs to be manually calculated using the RMS phase-neutral voltage and peak voltage.
Frequency: Measurement of frequency is important for generator fed systems. Electric utilities usually have very stable voltage and is not of concern in most countries. An off-nominal frequency can cause damaging effect on transformers due to transformer saturation. Bad frequency can also cause timers that rely on zero crossing to miss behave.
Pulse Width: Using multimeters % duty cycle function (amount of time the signal is high or low), obtain pulse width of sine wave using the formula below.
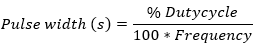
For an ideal sine wave % Duty cycle should be 50% (Signal is high and low for 50% of time). Let’s say the measured frequency is 60 Hz. This gives a pulse width of 8.33ms.
While measuring pulse width may not make much sense for a utility voltage signal, it provides useful information when measured on inverter outputs. Figure 5 shows the output voltage of a DC to AC inverter. Notice the unique shape of voltage waveform.
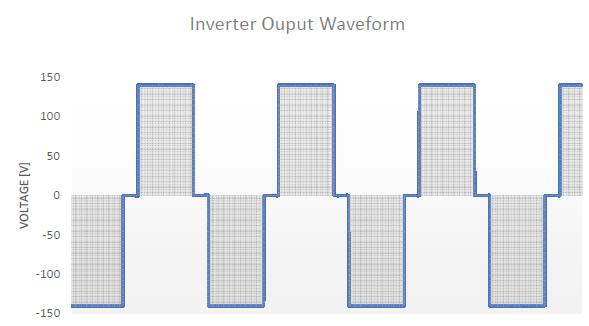
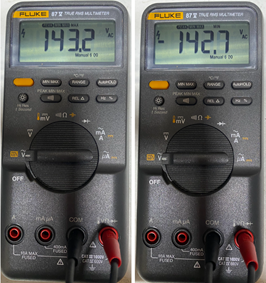
Measuring RMS voltage of waveform shown in figure 5 indicates ~120VAC. The peak voltage measurement indicates interesting results as shown in figure 6. The expected peak voltage for 120VAC sine wave is 169.68V whereas multimeter shows positive peak of 143.2V and negative peak of -142.7V. Multimeter reading thus provides valuable information that the voltage peak is very low and flat topped.
Measurement of duty cycle indicates the waveform has 49.9% duty cycle and frequency of 59.94 Hz. This gives the pulse width as 8.32 [ms] close to expected 8.33ms for a 60Hz waveform.
Thus, without seeing the waveform we could have identified just by using a capable multimeter that this waveform has lower peak voltage but nominal RMS voltage. Further, a trained eye could have deduced that this indicates a flat peak but ‘broader’ waveform.
Voltage Drop: Voltage drop can be easily measured if the multimeter has a ‘relative mode’. First, phase-neutral voltage at the service entrance [source] panel is measured. Next press the relative mode on the multimeter and measure the voltage at the load. Difference of voltage is the voltage drop for phase-neutral voltage. Similar method can also be used to measure the neutral-ground voltage drop magnitude.