ITIC Curve
History
ITIC curve is published by Information Technology Industry Council (ITIC) formerly known as Computer & Business Equipment Manufacturer’s Association (CBEMA). This curve provides an AC voltage boundary that most information technology equipment (ITE) can tolerate or ride through without experiencing unexpected shutdowns or malfunctions. Information technology equipment could include single phase computers, printers, scanners etc. The CBEMA curve is a precursor to ITIC curve and was published in the 1970’s.
The origination of CBEMA curve goes back to 1977 when Computer and Business Equipment Manufacturers Association ESC-3 working group was asked to provide their input in to an energy performance profile for computer equipment that was proposed for publication in IEEE Std 446. After some minor modifications to the proposal, the ESC-3 working group approved this initial version of the curve, which remained unchanged until early in 1996. Throughout the next 20 years that the original version was published, it grew in stature from a simple curve describing the performance of mainframe computer equipment (PCs were not available), to a curve that was used to define everything from specification criteria for electronic equipment to the basis of power quality performance contracts between electric utilities and large industrial customers. Obviously, this is quite an extension from the initial intent of describing the power quality performance of typical mainframe computers. [IEEE 1100]
Even though both ITIC and CBEMA names are used interchangeably there are subtle differences.
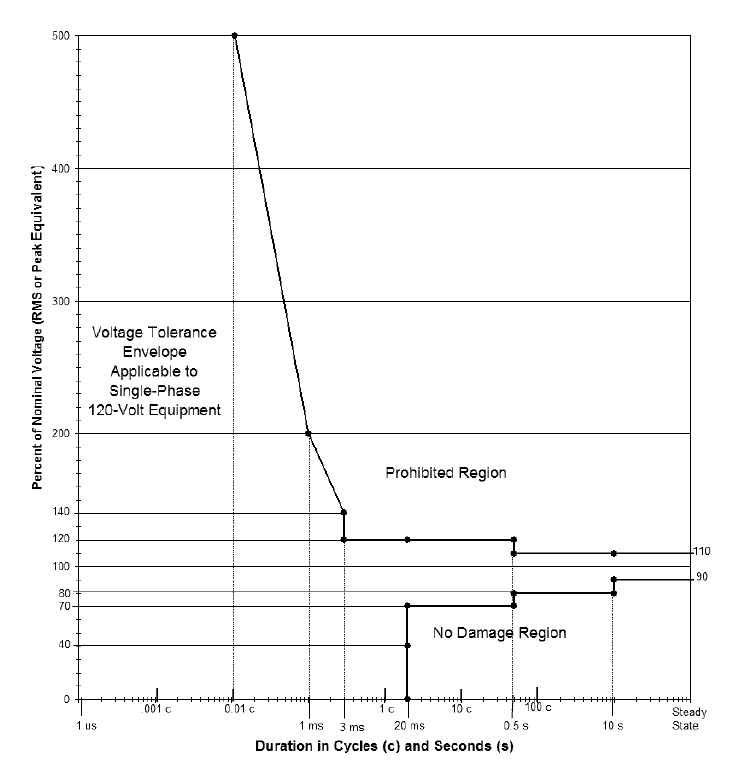
New ITI Curve (CBEMA) Curve (2000)
Application
The curve is primarily intended for 120V, 120/208V and 120/240V 60Hz systems. Other voltages are not specifically part of this and it is the responsibility of the user to verify that the curve is applied correctly at other voltages. People tend to extrapolate these curves to 480V or even higher voltages and also as a general metric of incoming power quality. While there is no harm in using this as a reference to establish a baseline power quality, it is important to recognize that the original intent of the curve was for 120V single phase computer equipment. The curve describes an AC voltage envelop which typically can be tolerate by ITE equipment. The curve describes both steady state and transitory conditions.
Information Technology Equipment (ITE Equipment)
ITE equipment includes common office equipment such as computers and its related peripheral equipment. Most modern ITE equipment are powered by a switched mode power supply. The front end of the switched mode power supply has a bridge rectifier that rectifies the incoming AC to DC. The rectified DC is stored in the bus capacitor. The DC voltage is further converted to the required voltage and is in turn used to power the various subsystems inside the ITE equipment.
During a power system disturbance, like a voltage sag, swell or a transient voltage for example, the DC bus voltage could go very low or very high and in turn affect the reliable operation of the ITE equipment. The ITIC curve is essentially an input voltage vs duration performance plot that covers sags, swells, transients, interruptions and steady state voltage variation at the input terminals to the ITE equipment.
It should be noted that the individual manufacturers performance to input voltage fluctuation is difficult to quantify as each many use a different technology inside their switched mode power supply.
ITIC Curve (New CBEMA Curve)
Due to the importance of the previous CBEMA curve, a working group and several sponsors undertook the task of revising the curve based on actual test results. The basis of this curve is supported by tests that were conducted on a representative sample of eight PC power supplies supplied by eight different manufacturers.
The older CBEMA curve is very ‘smooth’ whereas the ITIC curve (New CBEMA Curve) has discrete steps and is relatively easier to program in power quality meters and in spreadsheet platforms.
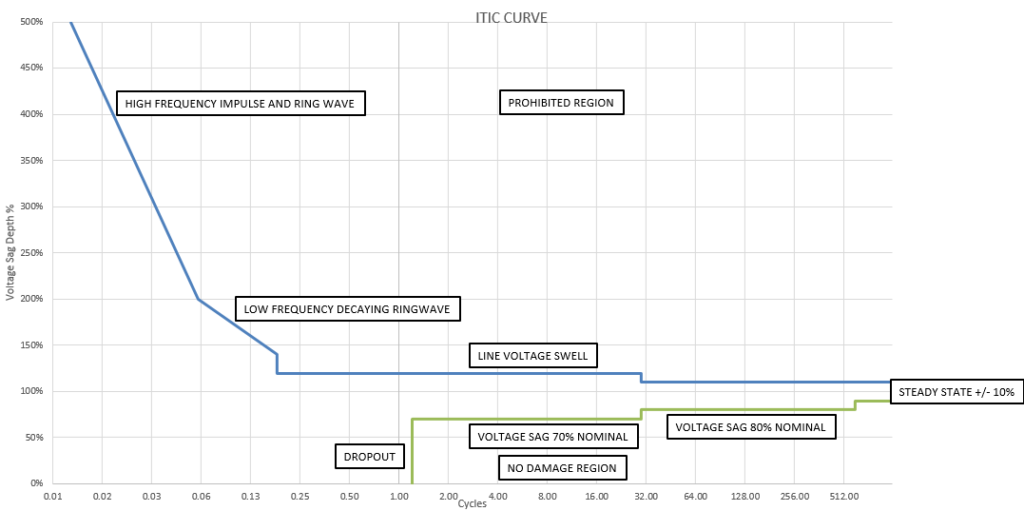
ITIC CURVE
Conditions
Nominal Voltage: Nominal voltage is considered to be 120V RMS, 60Hz
Steady State Tolerance: +/- 10% from the nominal voltage. This is shown in the right portion of the curve.
Line Voltage Swell: Up to 120% of the RMS nominal voltage with duration of up to 0.5 seconds.
Low Frequency Decaying Ringwave: This region describes the decaying ringwave which results from capacitor banks switching. The frequency of transient may range from 200Hz to 5KHz. The magnitude of transient is expressed as a percentage of the peak of 60Hz nominal voltage (not the RMS value). Transient is assumed to occur near the peak of the nominal voltage waveform. The transient is assumed to be completely decayed by the end of half-cycle in which it occurs. The amplitude of transient varies from 140% to 200%.
High-Frequency Impulse and Ringwave: This region above 200% describes the transients that typically result from lightning strikes. Waveshape applicable to this transient and the general test conditions are described in ANSI/IEEE C62.41-1991.
Voltage Sag: Two different RMS voltage sags are described. Sags to 80% of nominal for up to 10 seconds (600 cycles) and sags to 70% of nominal for up to 0.5 seconds (30 cycles). Voltage sag is an RMS reduction in the AC voltage, at the power frequency, for duration from half cycle to few seconds [IEEE 1100]. The IEC terminology for this phenomenon is voltage dip. Voltage sags are most often caused by faults on the utility system although they may be caused by faults within the facility or by large motor starts. IEEE standard 1159 defines voltage sag as a decrease in RMS voltage at the power frequency for duration from 0.5 cycle to 1 minute, reported as the remaining voltage.
Dropout: Voltage dropout includes both severe RMS voltage sags and complete interruptions of the applied voltage, followed by immediate re-application of the nominal voltage. Interruption may last up to 20 milliseconds (1.2 cycles). This transient could occur during a temporary fault in the power system followed by clearing of the fault.
No Damage Region: Voltage sags, dropouts, and steady state voltages in this region are not expected to damage the ITE equipment. Normal functioning of ITE equipment is also not expected in region.
Prohibited Region: Any surges or swell in this region could result in damage to the ITE equipment.
Limitation of Using the ITIC curve (New CBEMA Curve)
Compatibility of the Information Technology Equipment to ITIC curves does not necessarily result in trouble free operation of the IT infrastructure. ITIC curve only address the quality of incoming power to the IT equipment. There are many other variables that could affect the reliable operation of IT equipment. Some of which are unequal ground potentials, Electromagnetic Noise Interference etc.
Other Voltage Ride Through Standards
SEMI F47-0706 is the specification for Semiconductor Processing Equipment voltage sag immunity originally published in year 2000 and updated in 2006. The standard has been implemented by essentially all semiconductor fabs and has been a huge cost saver for the industry. Semiconductor wafer production is very sensitive to voltage sag (voltage dip) events and one voltage sag event could cost facility hundreds of thousands of dollars per voltage sag event.
SEMI F47 sets out limits of voltage sag that the equipment needs to tolerate without creating any process upsets or shutdowns. SEMI F47 suggests that semiconductor manufacturers may use this standard in their specification whenever they purchase equipment. By doing so the manufacturer can make sure all the equipment used for semiconductor production has been tested and certified to SEMI F47 standard. Compared to other voltage sag immunity curves (CBEMA, ITIC), SEMI standard is more stringent on the tolerance limits.
SEMI F47 does not address product quality and the purpose of the standard is to keep the equipment running without any operator intervention when exposed to voltage sags above the tolerance curve.
SEMI F47 – 0706 references IEC standard (IEC 61000-4-34) for test protocol information.
Some Examples of Voltage Disturbances
1) Steady State Voltage Variation: The graph below shows the steady state voltage variation over a period. In this case the nominal voltage is 480V and the variation is within +/- 10%.
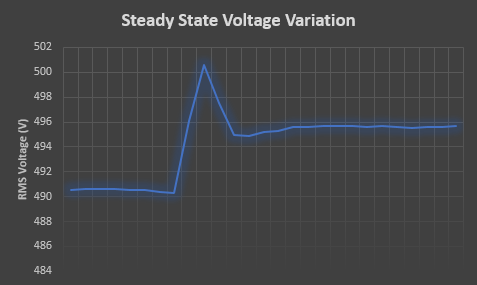
Steady State Voltage Variation
2) Capacitor Switching Transient: The waveform below shows the capacitor switching transient captured inside a facility when the bank was switched on at the utility substation. Note that the event creates a peak transient followed by low frequency decaying ringwave. These types of transients could cause variable frequency drive over voltage trip, failure of surge protective devices etc. In the worst case if the switching creates a voltage transient that creates another zero crossing of the voltage waveform on the x-axis, then equipment that relay on zero crossing may malfunction. This could include thyristor controlled heaters, some digital clocks etc. Read voltage notching for additional information on this type of disturbance.
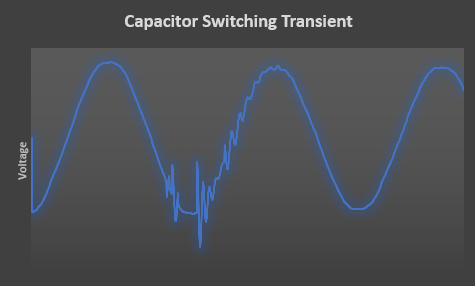
Capacitor Switching Transient
3) Voltage Sag:
Voltage sags occur when then there is some fault on the system or during starting of large loads (motors) etc. Graph below shows a voltage sag event followed by recovery followed by another voltage sag.
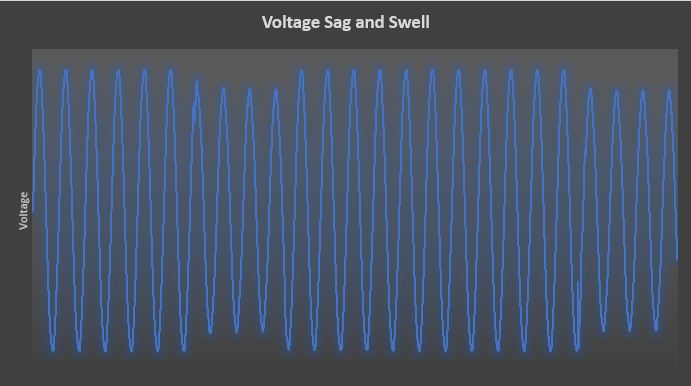
Voltage Sag
Also Read: